Auto label placement
| Date: | 2007 |
| Desc: | It is an experiment tool for showing the result of an auto placement algorithm. |
| Skill: | Flash Action Script |
| DEMO: | quadtree.swf |
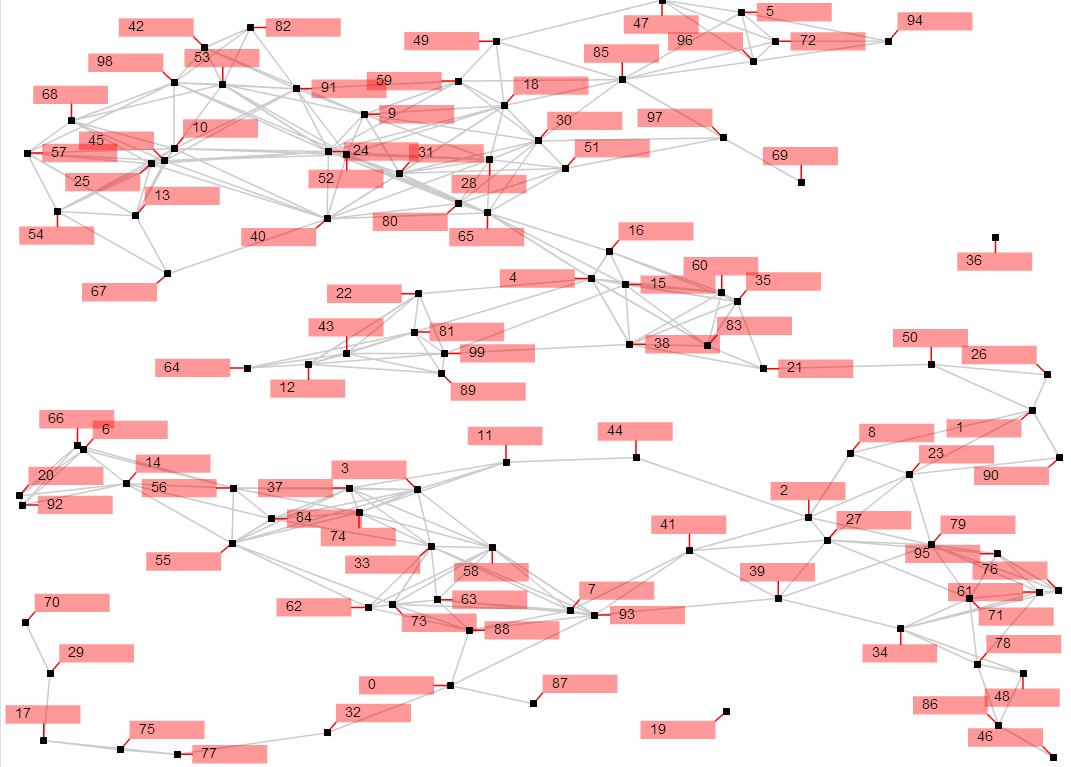
There are a bunch of nodes displayed in a network graph. Each node has a label space which is represented by a red rectangle.
Imagine that each node (the small black square) is a city on the map, and the red rectangles are where we will display the city name.
The objective is to avoid or minimize the overlapping of the red rectangles.
You can drag any nodes with your mouse to move them to a new position. Its label will be repositioned automatically.
The internal data structure is using quad tree. During the dragging, you can see yellow rectangle lines which represents the levels of quad tree.
The gray lines are only connecting the nodes where their label space may overlap (within the green rectangle).
Only connected neighboring nodes will be involved in the recomputation of new label placement when a node is being dragged.
To limit the search space, the label position is limited to only 8 possible positions (N, NE, E, SE, S, SW, W, NW).